Fishbone Chart
A Fishbone Chart (also known as an Ishikawa Diagram or Cause-and-Effect Diagram) is a visual tool used to systematically identify and analyze the root causes of a problem. It is structured like a fish skeleton, with the main problem at the head and the potential causes branching off as bones.
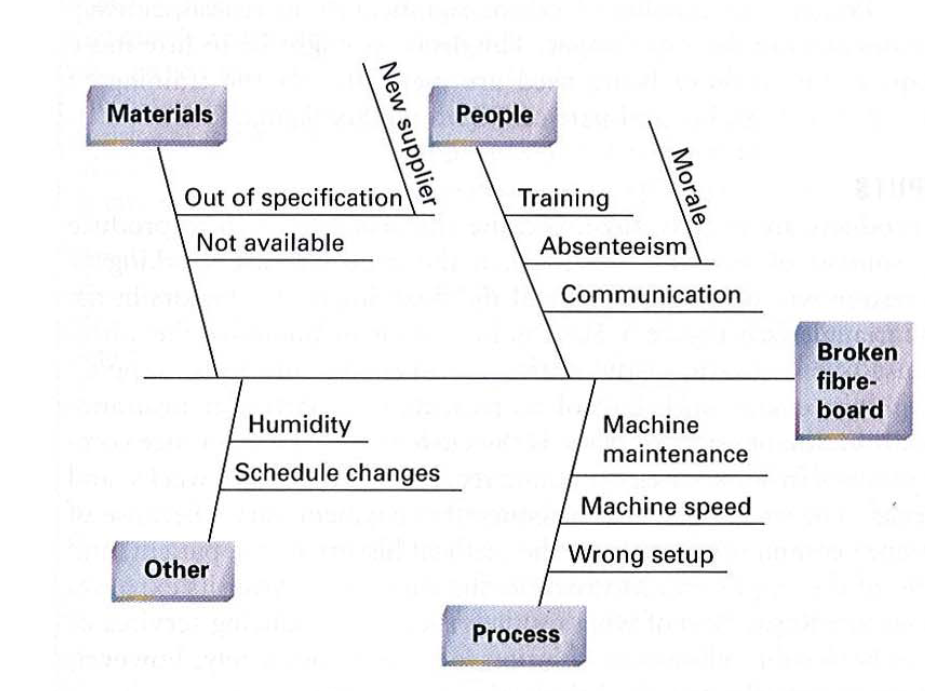
In the below example, one of the products has a problem, it has a broken fibre-board. So we employ a fishbone chart to narrow down what could be the root causes.