Statistical Process Control (SPC)
Statistical Process Control (SPC) is a method of quality control that uses statistical techniques to monitor and control a process. The goal of SPC is to ensure that the process operates efficiently, producing more specification-conforming products with less waste (rework or scrap).
Really the question comes down to, imagine that the proportion of claimants receiving late payments rose from 1% to 3%, SPC can help us determine if this is a cause for concern or just a random occurrence.
Method
SPC replies on periodic sampling to the process and plotting two key metrics, the average of the samples, and the range of the samples. You should take at least 20 separate sets of samples.
- Collect the data and take samples.
- Compute the range of each sample (max - min) and the average range of the ~20 samples for the set of samples.
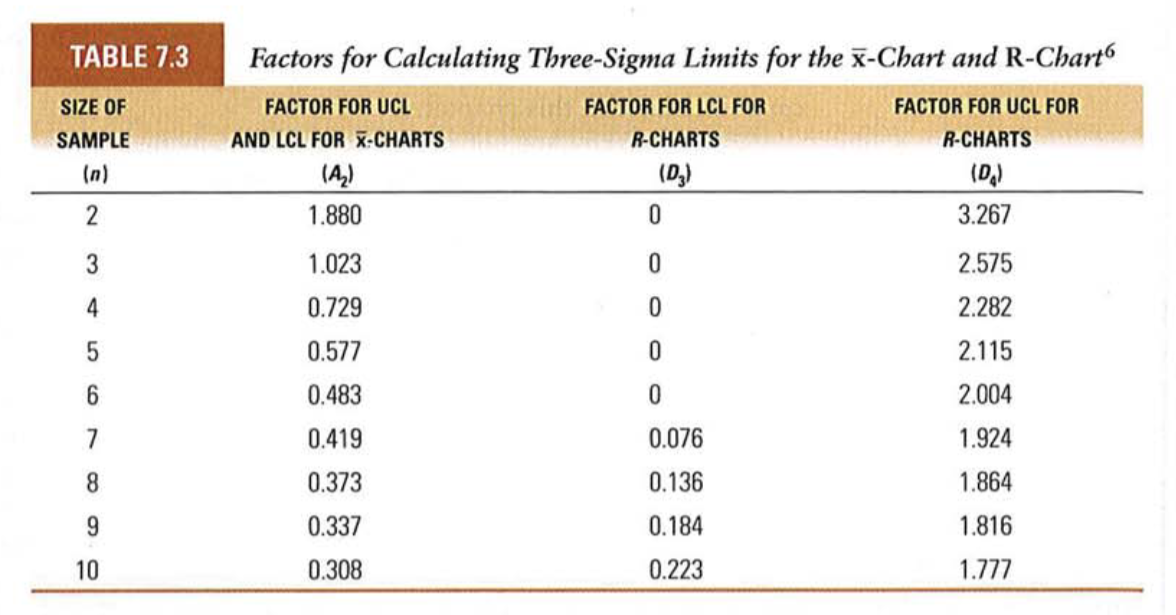
- Use the below table to compute upper and lower control limits of .
- Plot the sample ranges, if all are within acceptable ranges, continue. Otherwise, find the assignable causes, correct them, and return to step 1.
- Calculate for each sample and average all the averages to get .
- Use the below table to calculate the control limits.
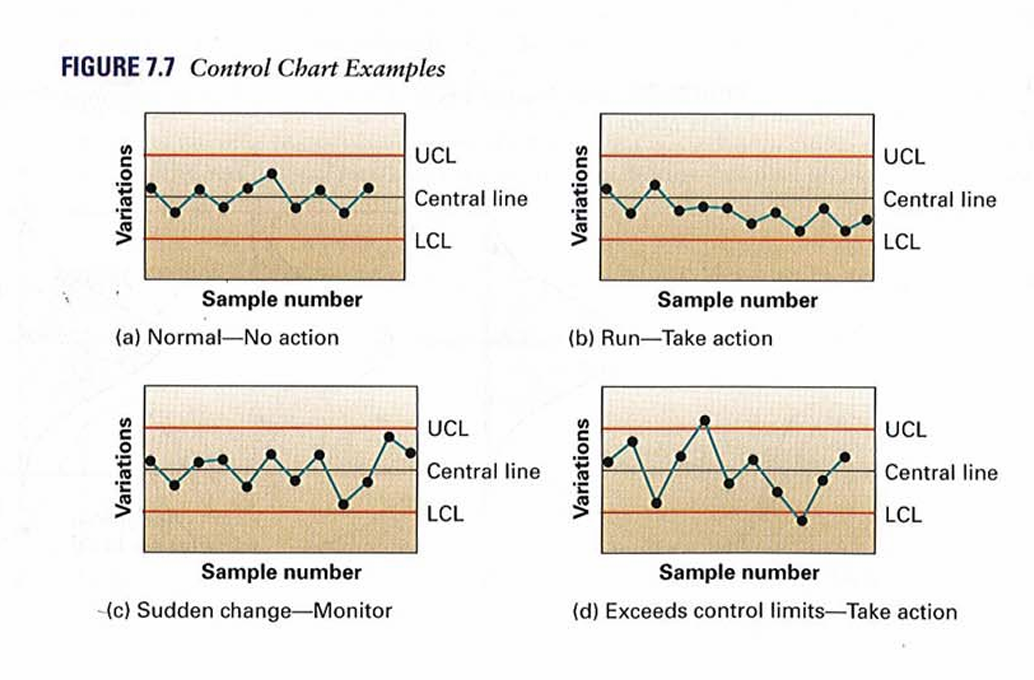
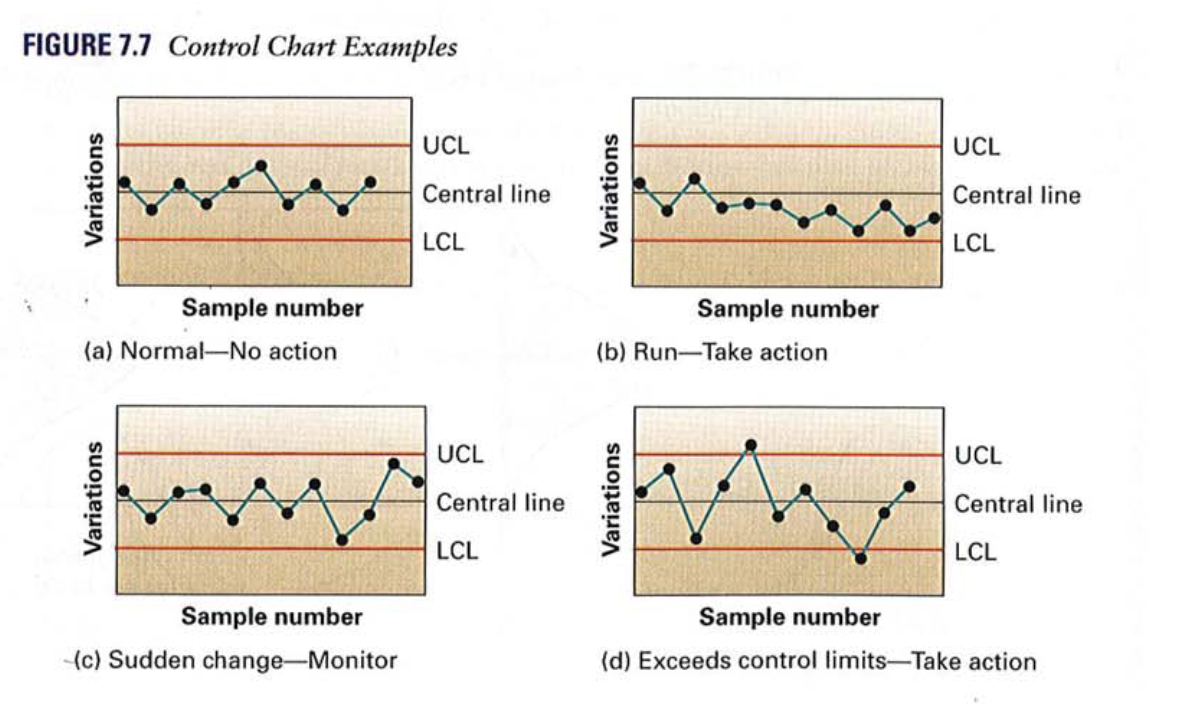
- Plot the sample means. If they are in control, you are ok. If not, also make sure the graph looks random.
Table
Formulas
Control limits for
Control limits for